
Before you get started, take this readiness quiz.
We have graphed equations of the form \(Ax+By=C\). We called equations like this linear equations because their graphs are straight lines.
Now, we will graph equations of the form \(y=ax^2+bx+c\). We call this kind of equation a quadratic equation in two variables.
A quadratic equation in two variables, where a,b,and c are real numbers and \(a\neq 0\), is an equation of the form \[y=ax^2+bx+c \nonumber\]
Just like we started graphing linear equations by plotting points, we will do the same for quadratic equations.
Let’s look first at graphing the quadratic equation \(y=x^2\). We will choose integer values of x between −2 and 2 and find their y values. See Table.
| \(y=x^2\) | |
| x | y |
| 0 | 0 |
| 1 | 1 |
| \(−1\) | 1 |
| 2 | 4 |
| \(−2\) | 4 |
Notice when we let \(x=1\) and \(x=−1\), we got the same value for y.
The same thing happened when we let \(x=2\) and \(x=−2\).
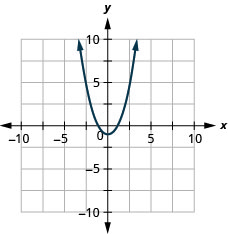
Now, we will plot the points to show the graph of \(y=x^2\). See Figure.
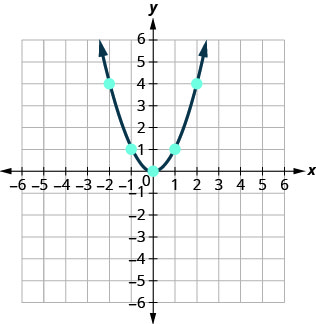
The graph is not a line. This figure is called a parabola. Every quadratic equation has a graph that looks like this.
In Example you will practice graphing a parabola by plotting a few points.
Answer
We will graph the equation by plotting points.
| Choose integers values for x, substitute them into the equation and solve for y. | ||
| Record the values of the ordered pairs in the chart. | 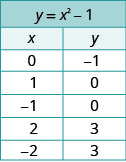 | |
| Plot the points, and then connect them with a smooth curve. The result will be the graph of the equation \(y=x^2−1\) | 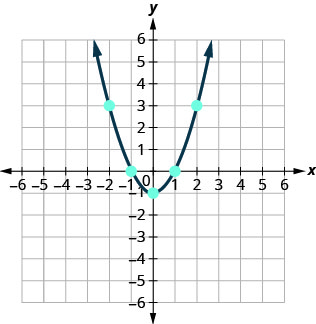 | |
Answer
Answer
How do the equations \(y=x^2\) and \(y=x^2−1\) differ? What is the difference between their graphs? How are their graphs the same?
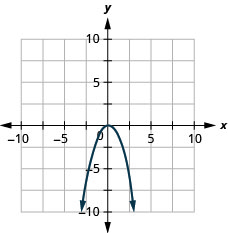
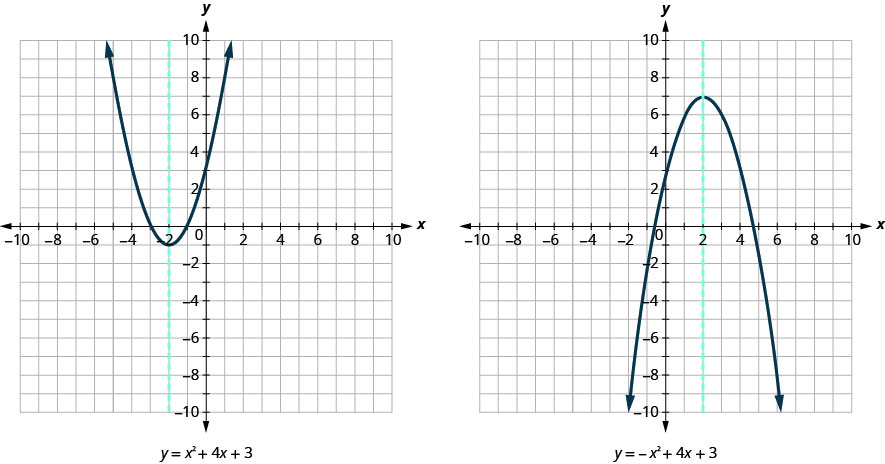
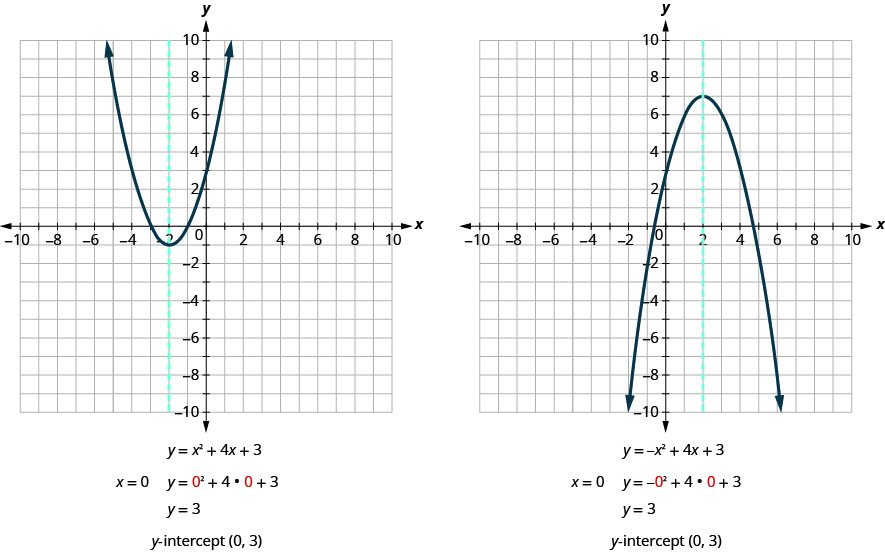
All parabolas of the form \(y=ax^2+bx+c\) open upwards or downwards. See Figure .
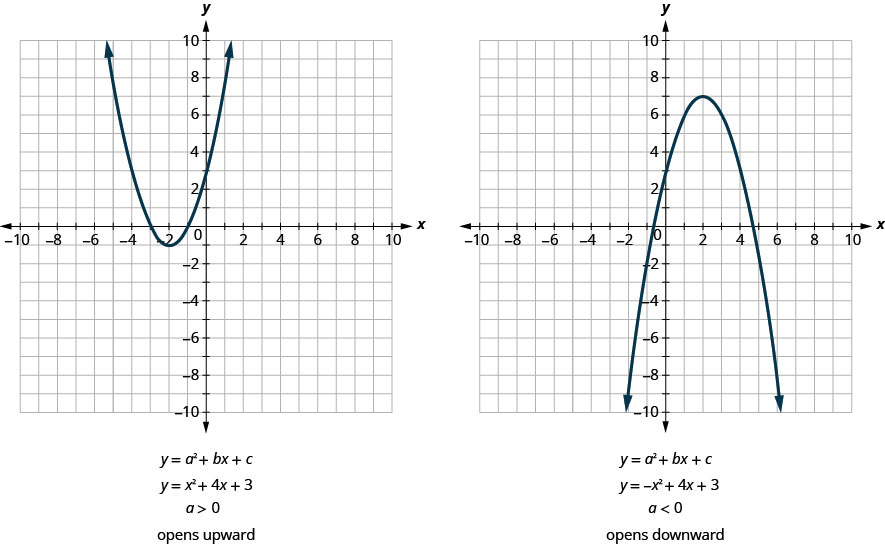
Notice that the only difference in the two equations is the negative sign before the \(x^2\) in the equation of the second graph in Figure. When the \(x^2\) term is positive, the parabola opens upward, and when the \(x^2\) term is negative, the parabola opens downward.
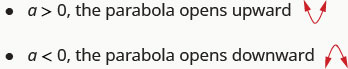
For the quadratic equation \(y=ax^2+bx+c\), if:
Determine whether each parabola opens upward or downward:
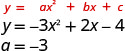
Since the “a” is negative, the parabola will open downward.
Since the “a” is positive, the parabola will open upward.
Determine whether each parabola opens upward or downward:
Determine whether each parabola opens upward or downward:
Look again at Figure. Do you see that we could fold each parabola in half and that one side would lie on top of the other? The ‘fold line’ is a line of symmetry. We call it the axis of symmetry of the parabola.
We show the same two graphs again with the axis of symmetry in red. See Figure.
The equation of the axis of symmetry can be derived by using the Quadratic Formula. We will omit the derivation here and proceed directly to using the result. The equation of the axis of symmetry of the graph of \(y=ax^2+bx+c\) is x=\(−\frac\).
So, to find the equation of symmetry of each of the parabolas we graphed above, we will substitute into the formula x=\(−\frac\).
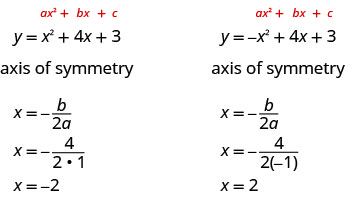 quantity 2 times 1, which simplifies to x equals negative 2. On the right side the standard form of a quadratic equation which is y equals a x squared plus b x plus c is written above the given equation y equals negative x squared plus 4 x plus 3. The axis of symmetry is the equation x equals negative b divided by the quantity two times a. Plugging in the values of a and b from the quadratic equation the formula becomes x equals negative 4 divided by the quantity 2 times -1, which simplifies to x equals 2." />
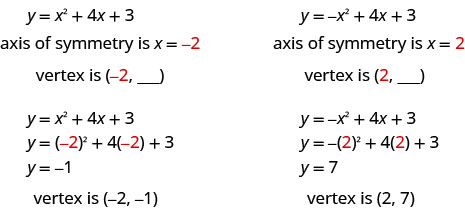
The point on the parabola that is on the axis of symmetry is the lowest or highest point on the parabola, depending on whether the parabola opens upwards or downwards. This point is called the vertex of the parabola.
We can easily find the coordinates of the vertex, because we know it is on the axis of symmetry. This means its x-coordinate is \(−\frac\). To find the y-coordinate of the vertex, we substitute the value of the x-coordinate into the quadratic equation.
For a parabola with equation \(y=ax^2+bx+c\):
To find the y-coordinate of the vertex, we substitute x=\(−\frac\) into the quadratic equation.
For the parabola \(y=3x^2−6x+2\) find:
| 1. | 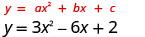 | |
| The axis of symmetry is the line x=\(−\frac\) |  | |
| Substitute the values of a, b into the equation. | 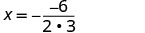 | |
| Simplify | x=1 | |
| The axis of symmetry is the line x=1 | ||
| 2. |  | |
| The vertex is on the line of symmetry, so its x-coordinate will be x=1 | ||
| Substitute x=1 into the equation and solve for y. | 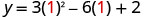 | |
| Simplify | 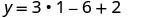 | |
| This is the y-coordinate. | y=−1 The vertex is (1,−1). | |
For the parabola \(y=2x^2−8x+1\) find:
For the parabola \(y=2x^2−4x−3\) find:
When we graphed linear equations, we often used the x- and y-intercepts to help us graph the lines. Finding the coordinates of the intercepts will help us to graph parabolas, too.
Remember, at the y-intercept the value of x is zero. So, to find the y-intercept, we substitute x=0 into the equation.
Let’s find the y-intercepts of the two parabolas shown in the figure below.
At an x-intercept, the value of y is zero. To find an x-intercept, we substitute \(y=0\) into the equation. In other words, we will need to solve the equation \(0=ax^2+bx+c\) for x.
But solving quadratic equations like this is exactly what we have done earlier in this chapter.
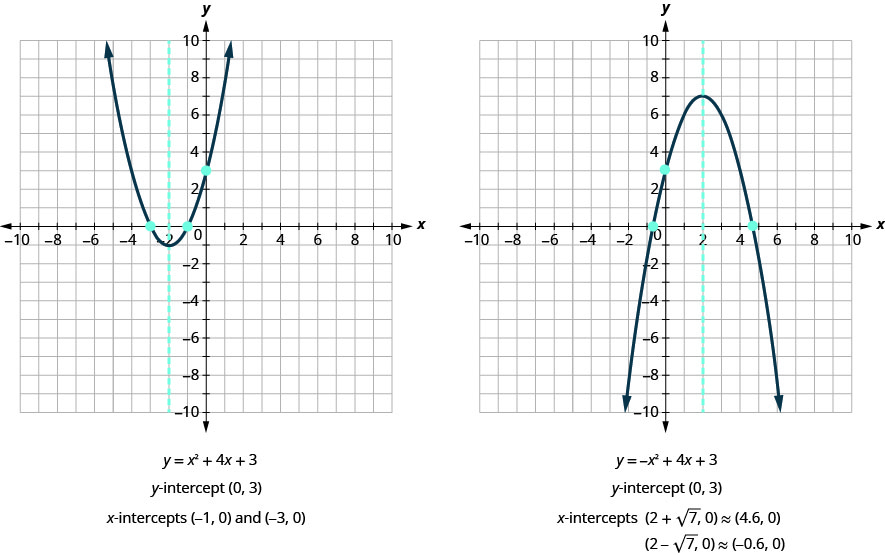
We can now find the x-intercepts of the two parabolas shown in Figure.
First, we will find the x-intercepts of a parabola with equation \(y=x^2+4x+3\).
 | ||
| Let y=0 |  | |
| Factor. | 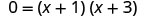 | |
| Use the zero product property. | 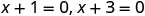 | |
| Solve. |  | |
| The x intercepts are (−1,0) and (−3,0). | ||
Now, we will find the x-intercepts of the parabola with equation \(y=−x^2+4x+3\).
 | ||
| Let y=0 |  | |
| This quadratic does not factor, so we use the Quadratic Formula. | 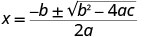 | |
| a=−1, b=4, c=3. | 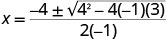 | |
| Simplify. | 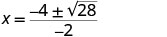 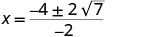 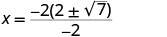 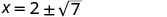 | |
| The x intercepts are \((2+\sqrt,0)\) and \((2−\sqrt,0)\) | ||
We will use the decimal approximations of the x-intercepts, so that we can locate these points on the graph.
Do these results agree with our graphs? See Figure.
To find the intercepts of a parabola with equation \(y=ax^2+bx+c\):
Find the intercepts of the parabola \(y=x^2−2x−8\).
Answer
Find the intercepts of the parabola \(y=x^2+2x−8\).
Answer
Find the intercepts of the parabola \(y=x^2−4x−12\).
Answer
In this chapter, we have been solving quadratic equations of the form \(ax^2+bx+c=0\). We solved for xx and the results were the solutions to the equation.
We are now looking at quadratic equations in two variables of the form \(y=ax^2+bx+c\). The graphs of these equations are parabolas. The x-intercepts of the parabolas occur where y=0.
The solutions of the quadratic equation are the x values of the x-intercepts.
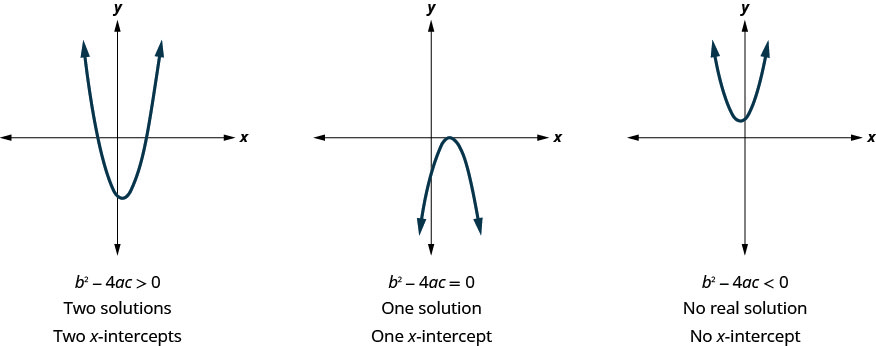
Earlier, we saw that quadratic equations have 2, 1, or 0 solutions. The graphs below show examples of parabolas for these three cases. Since the solutions of the equations give the x-intercepts of the graphs, the number of x-intercepts is the same as the number of solutions.
Previously, we used the discriminant to determine the number of solutions of a quadratic equation of the form \(ax^2+bx+c=0\). Now, we can use the discriminant to tell us how many x-intercepts there are on the graph.
Before you start solving the quadratic equation to find the values of the x-intercepts, you may want to evaluate the discriminant so you know how many solutions to expect.
Find the intercepts of the parabola \(y=5x^2+x+4\).
Answer